Uptime Kuma: Why HTTP 200 Can Hide a Broken App
HTTP 200 can hide a broken dependency. Reproduce 12 Uptime Kuma monitor results and learn when keyword checks miss what a JSON query catches.
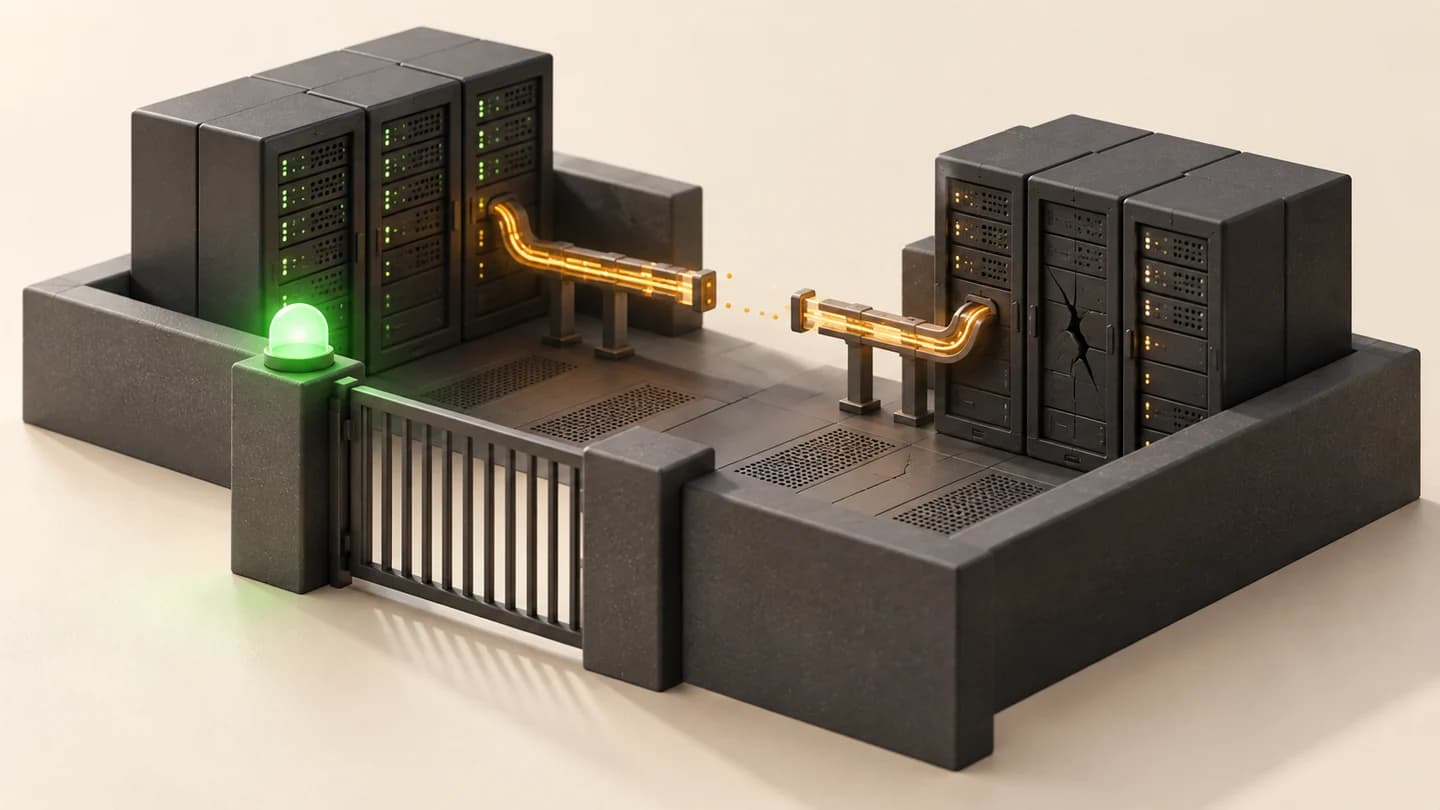
Uptime Kuma can show UP while your endpoint reports a failed dependency. If the endpoint still answers HTTP 200, add a check for the specific response field that matters. A broad keyword such as ok can miss the failure too.
The example below uses four small test responses and records what 12 real Uptime Kuma monitors reported. Use it before trusting the green badge on a self-hosted app or a service you just shipped.
Source checks and local experiment: September 9, 2026. Tested with Uptime Kuma 2.5.3. The responses are synthetic; no production database was disconnected.
The quick fix: For the example response below, select HTTP(s) – JSON Query, set the query to checks.database, the condition to ==, and the expected value to ok. Then deliberately return down and confirm the monitor changes state. Test delivery to your notification channel separately.
See the recorded results · Configure the monitor · Run the lab · Check the alert path · FAQ
HTTP 200 and a broken dependency can coexist
An accepted HTTP status tells you that the response passed your status-code rule. It does not establish that the database, queue, or feature behind that endpoint works.
Here is the deliberately broken response used in the lab. It arrives with HTTP 200:
{
  "status": "ok",
  "checks": {
    "database": "down"
  }
}
A status-only check accepts it. A keyword check for ok also accepts it because that text still appears in the top-level field. The database-specific query rejects it.
These are the observed states from Uptime Kuma 2.5.3. Every fixture in this table returns HTTP 200. Each monitor used zero retries and accepted only status 200.
| Response fixture | HTTP status check | Keyword: ok | JSON: checks.database == ok |
|---|---|---|---|
| Healthy database field | UP | UP | UP |
| Database field says down | UP | UP | DOWN |
| Database field is missing | UP | UP | DOWN |
| HTML sign-in page | UP | DOWN | DOWN |
Download the lab and recorded JSON results to inspect the exact response bodies, timestamps, configuration, and monitor messages. The HTML fixture directly returns a sign-in page; this experiment does not simulate a redirect or an expired session.
Each monitor followed its configured rule. The broad rules simply allowed this broken response to pass.
Why use Uptime Kuma for this check?
Uptime Kuma is a self-hosted monitoring app whose documented monitor types include HTTP, keyword matching, and JSON queries. The pinned release uses the MIT license. You can inspect both the project README and license on GitHub.
You can point all three monitor types at the same endpoint and compare the results. Start with your existing instance or a disposable local installation. This guide focuses on choosing the check; use the official installation guide for deployment instructions.
If you are still deciding whether to operate another service, use our six checks before adopting a repository. Hosting the monitor also means owning its availability and maintenance.
Configure a JSON query for the field you need
For this test response, check whether checks.database equals ok. Set it through the JSON query monitor rather than searching the whole response for the word ok.
Start the fixture from the download with python3 fixture.py. On the Linux host-network setup described in its README, create this monitor:
| Setting | Lab value |
|---|---|
| Monitor type | HTTP(s) – JSON Query |
| URL | http://127.0.0.1:8765/healthy |
| Method / accepted status | GET / 200 |
| JSON query | checks.database |
| Condition | == |
| Expected value | ok (no quotation marks) |
| Interval / retry interval | 20 seconds / 20 seconds |
| Retries / timeout / maximum redirects | 0 / 5 seconds / 0 |
The versioned editor source shows the query, condition, and expected-value inputs. Labels can change across versions. These are demonstration settings, not universal production defaults.
- Save the monitor and wait for a heartbeat against
/healthy. It should report UP. - Change only the URL path to
/broken. Wait for a new heartbeat. The recorded result is DOWN. - Repeat with
/missing, then/login. Both were DOWN in the recorded run. - Restore
/healthyand confirm recovery in your instance. Record the observation in the included worksheet.
If Kuma runs in an ordinary Docker bridge network, its 127.0.0.1 is the container itself. Follow the download’s Linux host-network example or choose an address reachable from your Kuma deployment. A connection failure caused by the wrong address is a different test.
When keyword monitoring helps, and when it misses
A keyword check helps when the response has a distinctive success marker. It is too broad when the same marker also appears in an error response.
In the pinned implementation, keyword matching checks whether the response contains the configured text. The invert option reverses that condition. A JSON query evaluates the selected expression and comparison instead. See the monitor implementation.
For an HTML page, choose text tied to the expected result and test an error page that keeps the usual navigation and footer. For a structured API response, select the field whose value changes when the dependency fails. Avoid treating a generic page title or the word ok anywhere in the body as proof of the whole app.
The field still needs to mean something. A hard-coded "database": "ok" is just another green badge. In your own service, define what the endpoint must actually observe before it returns that value, and make that observation fail in a controlled test.
Run the same failure lab yourself
The download contains the fixture server, a dependency-free Python check, a script that creates the real Kuma monitors, both recorded result files, and an acceptance worksheet.
Download the Uptime Kuma HTTP 200 lab ZIP. Extract it and open the uptime-kuma-lab directory in a terminal:
python3 check-fixture.pyThat command exercises the HTTP responses with independent Python checks. To reproduce the actual Uptime Kuma results, follow the README’s disposable Docker setup and run run-kuma.cjs inside that container. The download distinguishes the two runs explicitly.
The Kuma run used release 2.5.3, Node 22.22.3, SQLite storage, Linux host networking, and the pinned Docker image digest recorded in the README. It created 12 monitors and checked their first observed heartbeat states. It did not measure detection latency, exercise a real database, or send external notifications.
Use the worksheet to record recovery and alert delivery in your deployment. Those cells are blank because this experiment did not test them.
Verify the alert reaches someone
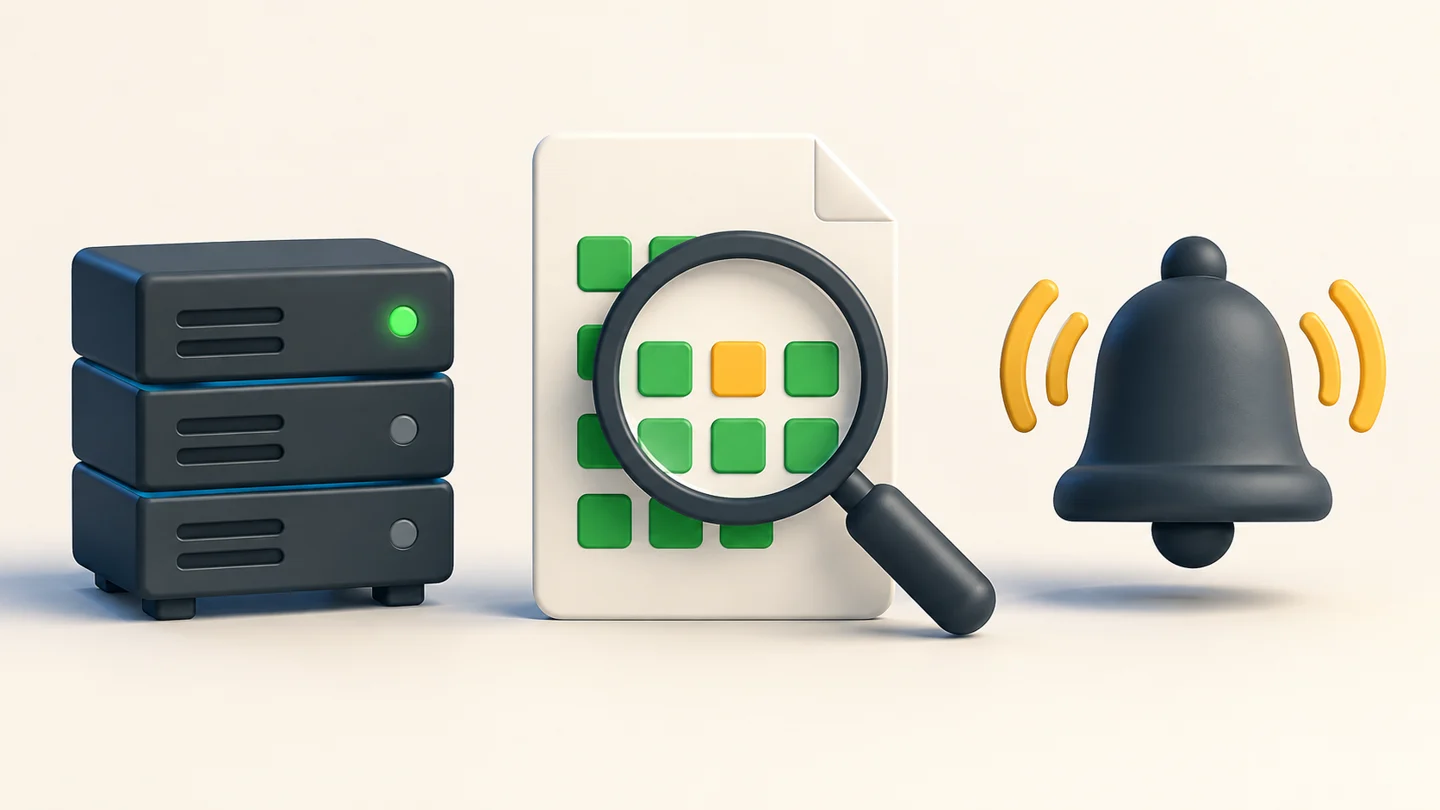
A DOWN state is only one step in the operational test. Attach your intended notification channel to the monitor and check that a controlled failure reaches the person who must respond.
- Use a disposable endpoint or a planned test window. Record the healthy response and the expected failure before changing anything.
- Trigger the failure. Confirm that the monitor reaches DOWN after your configured retries, then confirm receipt in the attached channel.
- Restore the response. Confirm the monitor recovers and inspect the recovery notification if your channel is configured to send it.
- Record who received the alert and when. Separately decide how you will notice if the monitor’s own host becomes unavailable.
For production, choose intervals, retries, and timeouts around the service’s response time and the interruption your team can tolerate. This lab’s zero-retry setting makes the example easy to inspect; it is not a paging policy.
Checking one response field does not prove that a user can sign in, save a document, or complete a purchase. Where that workflow matters, add a separate test that performs it with safe test data. Define the expected outcome before running the test. The painted bullseye failure mode has the same problem: the success rule is too easy to satisfy.
Questions about Uptime Kuma HTTP and JSON checks
Why does Uptime Kuma show UP when my app is broken?
Your monitor may be checking an HTTP status that the broken response still satisfies. In this lab, every fixture returned 200. Add a condition tied to the response field or user outcome you need, then verify it with a controlled failure.
What JSON query should I use for a database health field?
For this guide’s response shape, use checks.database, condition ==, and expected value ok without quotation marks. Adapt the field and value to your actual response, and test healthy, failed, and missing-field cases.
Does a keyword check for ok prove that an API is healthy?
No. In the recorded lab, the broken response kept a top-level status of ok while its database field said down. The keyword monitor stayed UP. Use a more specific marker or a query for the relevant field.
Did this lab test notifications or a real database outage?
No. It tested 12 real Uptime Kuma monitors against four synthetic HTTP responses. External notification delivery, recovery, real dependency failures, and complete user workflows require separate checks.
Start with one monitor you already rely on. Write down what its green state should prove, then give it a response that violates that promise. Keep the response and the observed result so the next person can repeat the check.
Disclosure: this article and its illustrations were prepared with AI assistance. The local experiment was executed during preparation; the exact scripts and outputs are in the download. Ranex publishes this guide for developers who want verifiable checks. No affiliation with the Uptime Kuma project is claimed.
About the author

Anthony Garces
Anthony Ryan M. Garces is a Senior Principal Lead Architect with 17+ years in IT, including four years at Pantheon on mission-critical platform work. He is building Ranex in public.
Keep reading
Your SQLite backup says OK. Two rows are missing.
A SQLite file copy passed its integrity check but missed committed rows. Reproduce it, then use the included backup utility and restore verification lab.
uv locked vs frozen: the missing dependency test
A passing uv sync can leave a new dependency uninstalled. Run this small lab to see why, then use the lockfile check that matches your CI requirement.
Open Source Signal, Week 1: What Held Up, What We Corrected, What We Left Out
Week 1 roundup: five verified highlights, five plain corrections, and what we left out, every restated fact re-checked against primary sources.